Close
- Information Technology
- Data Infrastructure
- Data Tools
- Desktops, Laptops and OS
- Chip Sets
- Collaboration Tools
- Desktop Systems - PCs
- Email Client
- Embedded Systems
- Hardware and Periferals
- Laptops
- Linux - Open Source
- Mac OS
- Memory Components
- Mobile Devices
- Presentation Software
- Processors
- Spreadsheets
- Thin Clients
- Upgrades and Migration
- Windows 7
- Windows Vista
- Windows XP
- Word Processing
- Workstations
- Enterprise Applications
- IT Infrastructure
- IT Management
- Networking and Communications
- Bluetooth
- DSL
- GPS
- GSM
- Industry Standard Protocols
- LAN - WAN
- Management
- Mobile - Wireless Communications
- Network
- Network Administration
- Network Design
- Network Disaster Recovery
- Network Interface Cards
- Network Operating Systems
- PBX
- RFID
- Scalability
- TCP - IP
- Telecom Hardware
- Telecom Regulation
- Telecom Services
- Telephony Architecture
- Unified Communications
- VPNs
- VoIP - IP Telephony
- Voice Mail
- WAP
- Wi-Fi (802.11)
- WiMAX (802.16)
- Wide Area Networks (WAN)
- Wireless Internet
- Wireless LAN
- Security
- Servers and Server OS
- Software and Web Development
- .Net Framework
- ASPs
- Application Development
- Application Servers
- Collaboration
- Component-Based
- Content Management
- E-Commerce - E-Business
- Enterprise Applications
- HTML
- IM
- IP Technologies
- Integration
- Internet
- Intranet
- J2EE
- Java
- Middleware
- Open Source
- Programming Languages
- Quality Assurance
- SAAS
- Service-Oriented Architecture (SOA)
- Software Engineering
- Software and Development
- Web Design
- Web Design and Development
- Web Development and Technology
- XML
- Storage
- Agriculture
- Automotive
- Career
- Construction
- Education
- Engineering
- Broadcast Engineering
- Chemical
- Civil and Environmental
- Control Engineering
- Design Engineering
- Electrical Engineering
- GIS
- General Engineering
- Industrial Engineering
- Manufacturing Engineering
- Materials Science
- Mechanical Engineering
- Medical Devices
- Photonics
- Power Engineering
- Process Engineering
- Test and Measurement
- Finance
- Food and Beverage
- Government
- Healthcare and Medical
- Human Resources
- Information Technology
- Data Infrastructure
- Data Tools
- Desktops, Laptops and OS
- Chip Sets
- Collaboration Tools
- Desktop Systems - PCs
- Email Client
- Embedded Systems
- Hardware and Periferals
- Laptops
- Linux - Open Source
- Mac OS
- Memory Components
- Mobile Devices
- Presentation Software
- Processors
- Spreadsheets
- Thin Clients
- Upgrades and Migration
- Windows 7
- Windows Vista
- Windows XP
- Word Processing
- Workstations
- Enterprise Applications
- IT Infrastructure
- IT Management
- Networking and Communications
- Bluetooth
- DSL
- GPS
- GSM
- Industry Standard Protocols
- LAN - WAN
- Management
- Mobile - Wireless Communications
- Network
- Network Administration
- Network Design
- Network Disaster Recovery
- Network Interface Cards
- Network Operating Systems
- PBX
- RFID
- Scalability
- TCP - IP
- Telecom Hardware
- Telecom Regulation
- Telecom Services
- Telephony Architecture
- Unified Communications
- VPNs
- VoIP - IP Telephony
- Voice Mail
- WAP
- Wi-Fi (802.11)
- WiMAX (802.16)
- Wide Area Networks (WAN)
- Wireless Internet
- Wireless LAN
- Security
- Servers and Server OS
- Software and Web Development
- .Net Framework
- ASPs
- Application Development
- Application Servers
- Collaboration
- Component-Based
- Content Management
- E-Commerce - E-Business
- Enterprise Applications
- HTML
- IM
- IP Technologies
- Integration
- Internet
- Intranet
- J2EE
- Java
- Middleware
- Open Source
- Programming Languages
- Quality Assurance
- SAAS
- Service-Oriented Architecture (SOA)
- Software Engineering
- Software and Development
- Web Design
- Web Design and Development
- Web Development and Technology
- XML
- Storage
- Life Sciences
- Lifestyle
- Management
- Manufacturing
- Marketing
- Meetings and Travel
- Multimedia
- Operations
- Retail
- Sales
- Trade/Professional Services
- Utility and Energy
- View All Topics
Share Your Content with Us
on TradePub.com for readers like you. LEARN MORE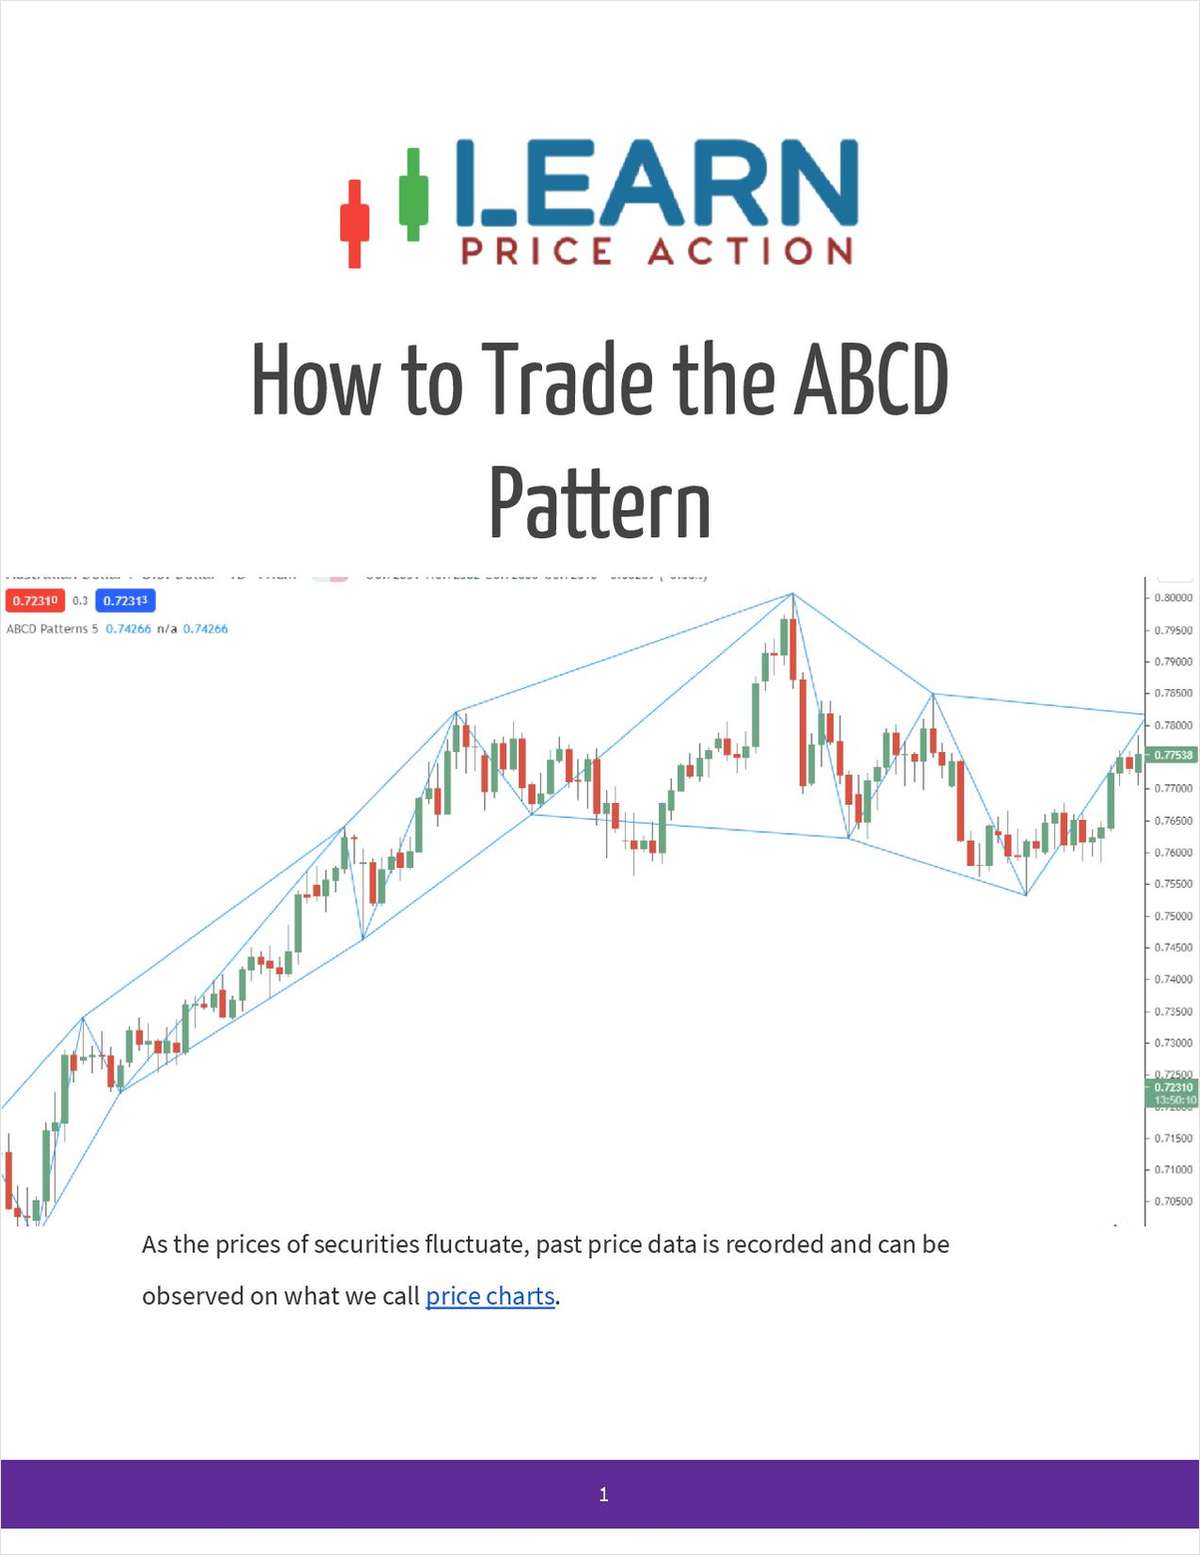

Request Your Free eGuide Now:
"How to Trade the ABCD Pattern"
As the prices of securities fluctuate, past price data is recorded and can be observed on what we call price charts.
If you have ever had any interest in the financial markets, you have no doubt seen a price chart before.
Occasionally, the data recorded onto these price charts form patterns. A pattern is simply a recognizable configuration of price movement. These distinctive formations form the basis of what we call technical analysis.
Technical analysts interpret these patterns in an attempt to predict future price movements. The basis of this belief is largely founded in human psychology and herd behavior.
This post will analyze a specific chart pattern known as the ABCD pattern. We examine how to use this pattern, its variations, and a couple of useful indicators that you can use when trading this pattern on the markets.
Offered Free by: Learn Price Action
See All Resources from: Learn Price Action
Recommended for Professionals Like You: